Data Handling Exercise 5.2
NCERT solutions for Class 8 Maths Data Handling
NCERT Solutions for Class 8 Maths Data Handling
Class –VIII Mathematics (Ex. 5.2)
NCERT SOLUTION
1. A survey was made to find the type of music that a certain group of young people liked in a city.
Adjoining pie chart shows the findings of this survey.
From this pie chart, answer the following:
(i) If 20 people liked classical music, how many young people were surveyed?
(ii) Which type of music is liked by the maximum number of people?
(iii) If a cassette company were to make 1000 CD’s, how many of each type would they make?
Ans. (i) 10% represents 100 people.
Therefore 20% represents = 
= 200 people
Hence, 200 people were surveyed.
(ii) Light music is liked by the maximum number of people.
(iii) CD’s of classical music = 
= 100
CD’s of semi-classical music =  = 200
= 200
CD’s of light music =  = 400
= 400
CD’s of folk music =  = 300
= 300
NCERT Solutions for Class 8 Maths Exercise 5.2
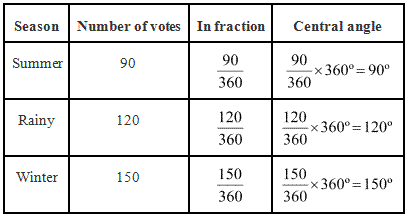
2. A group of 360 people were asked to vote for their favourite season from the three seasons rainy, winter and summer.
(i) Which season got the most votes?
(ii) Find the central angle of each sector.
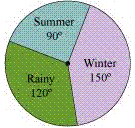
(iii) Draw a pie chart to show this information.
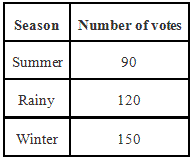
Ans. (i) Winter season got the most votes.
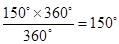
(ii) Central angle of summer season = 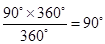
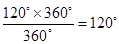
Central angle of rainy season
= 
Central angle of winter season
= 
(iii)
NCERT Solutions for Class 8 Maths Exercise 5.2
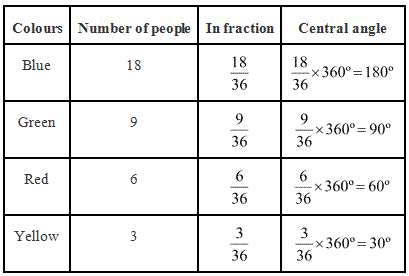
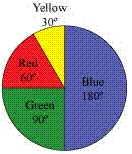
3. Draw a pie chart showing the following information. The table shows the colours preferred by a group of people.
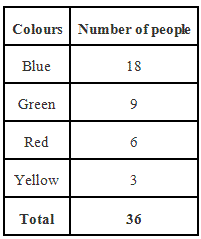
Ans. Here, central angle =  and total number of people = 36
NCERT Solutions for Class 8 Maths Exercise 5.2
4. The adjoining pie chart gives the marks scored in an examination by a student in Hindi, English, Mathematics, Social Science and Science. If the total marks obtained by the students were 540, answer the following questions:
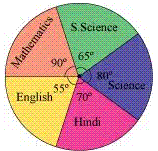
(i) In which subject did the student score 105 marks?
(Hint: for 540 marks, the central angle =  So, for 105 marks, what is the central angle?)
(ii) How many more marks were obtained by the student in Mathematics than in Hindi?
(iii) Examine whether the sum of the marks obtained in Social Science and Mathematics is more than that in Science and Hindi.
(Hint: Just study the central angles)
Ans.
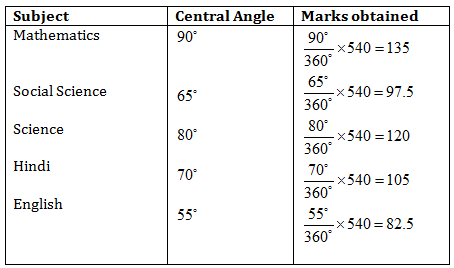
(i) The student scored 105 marks in Hindi.
(ii) Marks obtained in Mathematics = 135
Marks obtained in Hindi = 105
Difference = 135 – 105 = 30
Thus, 30 more marks were obtained by the student in Mathematics than in Hindi.
(iii) The sum of marks in Social Science and Mathematics = 97.5 + 135 = 232.5
The sum of marks in Science and Hindi = 120 + 105 = 225
Yes, the sum of the marks in Social Science and Mathematics is more than that in Science and Hindi.
NCERT Solutions for Class 8 Maths Exercise 5.2
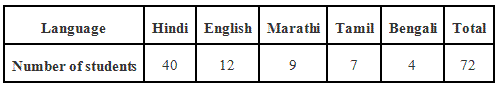
5. The number of students in a hostel, speaking different languages is given below.
Display the data in a pie chart.
Ans.
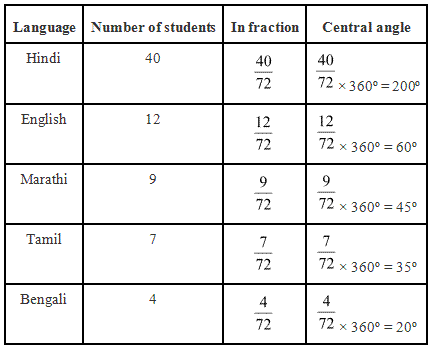
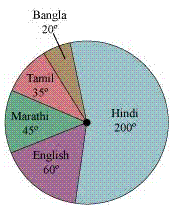
Pie chart at above given data is as follows.